

Highlights
- Nationwide, rents continue to fall. The national average across the top 50 metro areas slipped to $1,693, down 1% from last November.
- The asking rents for 0-, 1-, and 2-bedroom units are all down from last year at this time, though studio unit rent is closer to flat year over year than larger units.
- There are only 5 of the 50 largest metros in which two minimum-wage workers working 40 hours per week could afford the median rental unit, but two more are slated to join after minimum-wage increases in Michigan and Florida in 2026.
Market summary
Across the 50 largest metropolitan areas in the United States, median asking rent for 0-2 bedroom units fell for the 28th consecutive month on a year-over-year basis. The national rent level now stands at $1,693, down $6 from last month and $17 (or 1%) from last year. Asking rent is approaching its seasonal trough, usually bottoming out in the winter after peaking in early summer, but it is also notching a third straight November in which prices have fallen from the previous year.

The November peak came in 2022 at $1,735, 2.5% higher than this year’s November readout, showing that there has been modest relief since the post-pandemic run-up in rents. However, the overall rent level remains elevated. Compared to November 2019, when the national rent for 0-2 bedroom units was $1,445, rent is now 17.2% higher, crunching the budgets of renters across the country. Affordability is the key theme of the housing market in 2025, and this report will explore how rental affordability is improving at the same time that it remains a major financial burden for those at the lower ends of the income spectrum.
Rental units with 0, 1, and 2 bedrooms are all seeing their rents fall, as they have for most of the past several years, but this month’s breakdown shows a hint of a rebound among studio units.
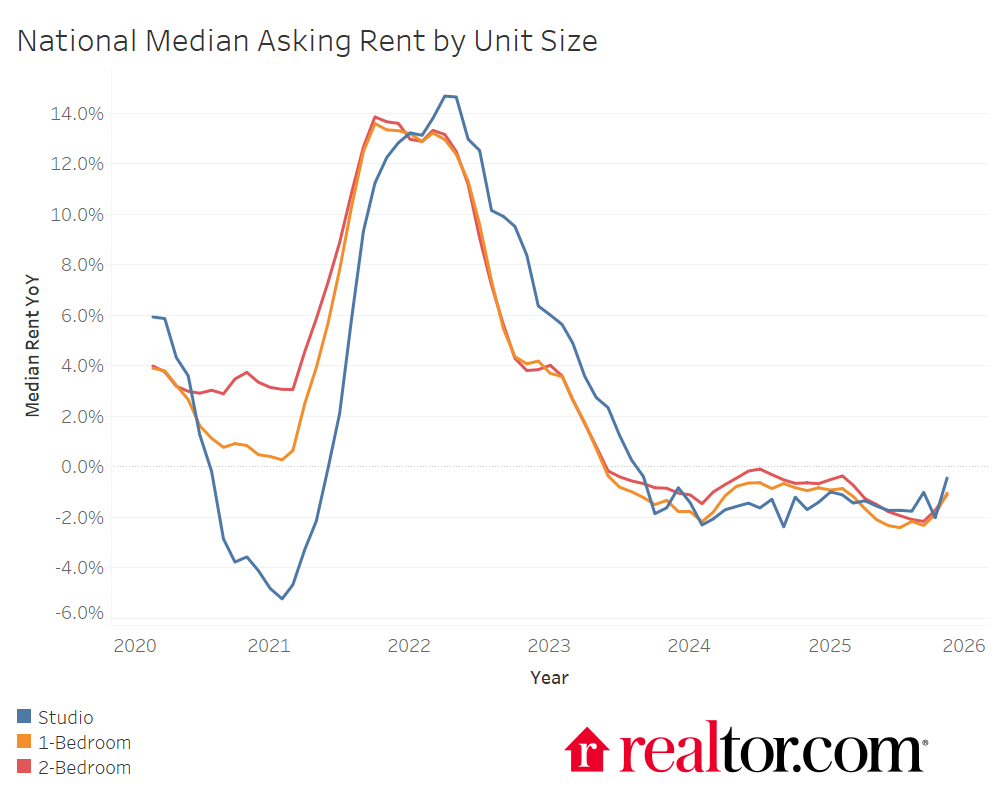
The year-over-year rent change for studios is just -0.4% while 1- and 2-bedroom units are seeing -1% and -1.1% growth rates, respectively. Studio rents tend to be a bit more volatile than larger units, as smaller unit rents tend to react more quickly to demand changes since their tenants tend to have more flexible living arrangements. Studio rents approaching flat growth year over year suggest that demand for rentals may be improving slightly, as people living in roommate or family home situations decide to strike out on their own. Larger unit rents are also trending closer toward a no-growth scenario, though not as quickly just yet.
| Unit Size | Median Rent | Rent YoY | Consecutive Months of YoY Decline | Rent vs. Nov 2022 | Rent vs. Nov 2019 |
| Overall | $1,693 | -1.0% | 28 | -2.4% | 17.2% |
| Studio | $1,418 | -0.4% | 27 | -3.7% | 12.2% |
| 1-Bedroom | $1,572 | -1.0% | 30 | -3.3% | 15.1% |
| 2-Bedroom | $1,874 | -1.1% | 30 | -2.5% | 19.3% |
Rental affordability improves for minimum-wage earners, especially in Florida and Michigan
Though rents have been falling over the past several years, they remain significantly elevated compared to where they were before the COVID-19 pandemic and represent a major financial hurdle to households across the country. This is especially true for those at the lowest end of the income spectrum. The federal minimum wage ($7.25/hour), which is not superseded by state or local minimum wages for much of the country, has not changed since 2009, making it increasingly difficult for minimum-wage earners to afford their rent.
To illustrate this challenge, we assume a two-earner household in which both renters earn the minimum wage for the primary city of their metro area and calculate how many hours they would both have to work per week to afford the median 0-2 bedroom rental in their metro. We further assume that they spend 30% of their income on rent. Surprisingly, there are only 5 among the top 50 metros where two minimum-wage earners together could afford the median rental in their metro without working overtime based on November 2025 rents and 2025 minimum wages. In all five, rent is below the national average and minimum wages are higher than the federal minimum of $7.25.
| Metro | Median Asking Rent (0-2 Bedrooms – Nov 2025) | 2025 Minimum Wage | Req’d MW Hours per Week per Renter 2025 |
| Buffalo-Cheektowaga, NY | $1,176 | $15.50 | 30 |
| Rochester, NY | $1,339 | $15.50 | 35 |
| St. Louis, MO-IL | $1,305 | $13.75 | 38 |
| Phoenix-Mesa-Chandler, AZ | $1,445 | $14.70 | 39 |
| Kansas City, MO-KS | $1,387 | $13.75 | 40 |
Detroit, MI, and Jacksonville, FL, are set to join this list in 2026 due to increases in the minimum wage in Michigan and Florida. The new year will usher in many increases to state and local minimum wages across the United States: Missouri and Rhode Island are both introducing minimum-wage increases of a dollar or more as well. In terms of minimum-wage hours, this represents an improvement to the hours worked by both members of a household in these metros most of all.
| Metro | Median Asking Rent (0-2 Bedrooms – Nov 2025) | 2025 Minimum Wage | 2026 Minimum Wage | Req’d MW Hours per Week per Renter 2026 | Diff 2025 to 2026 |
| Detroit-Warren-Dearborn, MI | $1,327 | $10.56 | $13.73 | 39 | -12 |
| Miami-Fort Lauderdale-West Palm Beach, FL | $2,287 | $13.00 | $15.00 | 61 | -9 |
| Tampa-St. Petersburg-Clearwater, FL | $1,672 | $13.00 | $15.00 | 45 | -7 |
| Orlando-Kissimmee-Sanford, FL | $1,650 | $13.00 | $15.00 | 44 | -7 |
| Jacksonville, FL | $1,457 | $13.00 | $15.00 | 39 | -6 |
Even then, for 43 of the 50 largest metropolitan areas in the country, the median rental unit is unaffordable when split by two minimum-wage earners. Below are the 10 metros where minimum-wage earners must work the longest hours to afford the median rental. Only one (San Jose, CA) has an increase to the minimum wage scheduled for 2026, and the other nine all default to the federal minimum wage. Only Philadelphia and San Jose have a median rent above the national average.
| Metro | Median Asking Rent (0-2 Bedrooms – Nov 2025) | 2026 Minimum Wage | Req’d MW Hours per Week per Renter 2026 | Minimum-Wage Increase Scheduled in 2026 |
| Philadelphia-Camden-Wilmington, PA-NJ-DE-MD | $1,739 | $7.25 | 96 | No |
| Milwaukee-Waukesha, WI | $1,685 | $7.25 | 93 | No |
| Atlanta-Sandy Springs-Roswell, GA | $1,543 | $7.25 | 85 | No |
| Nashville-Davidson–Murfreesboro–Franklin, TN | $1,511 | $7.25 | 83 | No |
| Charlotte-Concord-Gastonia, NC-SC | $1,498 | $7.25 | 83 | No |
| Raleigh-Cary, NC | $1,478 | $7.25 | 82 | No |
| Pittsburgh, PA | $1,471 | $7.25 | 81 | No |
| San Jose-Sunnyvale-Santa Clara, CA | $3,363 | $16.90 | 80 | Yes |
| Dallas-Fort Worth-Arlington, TX | $1,441 | $7.25 | 80 | No |
| Austin-Round Rock-San Marcos, TX | $1,388 | $7.25 | 77 | No |
To be sure, these are not all binding minimum wages. In many cases, the market’s minimum is actually above the statutory minimum, meaning that the actual going rate for entry-level work is higher than the law would suggest, and relatively few workers are actually paid the statutory minimum wage. In fact, the entry-level wage at McDonald’s listed on Indeed ranges from about $11 to $13 per hour for this group (excluding San Jose), well above their statutory $7.25 minimum wage. In San Jose proper, the minimum wage is nearly binding: Fast-food workers have a minimum of $20 per hour and make close to that. At the basic California minimum wage of $16.90, two minimum-wage workers would have to work 80 hours per week to share the median rental unit. Even at the higher sector-specific minimum wage of $20, two fast-food workers in San Jose must both work 67 hours per week to afford the median rental unit for the entire metropolitan area, which includes all of Santa Clara and San Benito counties.
Methodology
Rental data as of November 2025 for studio, 1-bedroom, or 2-bedroom units advertised for rent on Realtor.com. Rental units include apartments as well as private rentals (condos, townhomes, single-family homes). We use rental sources that reliably report data each month within the 50 largest metropolitan areas. Realtor.com began publishing regular monthly rental trends reports in October 2020 with data history stretching to March 2019. Minimum-wage data is sourced from ADP and the U.S. Department of Labor. McDonald’s crew member wages come from listings on Indeed.
Appendix
| Metro | Median Asking Rent (0-2 Bedrooms – Nov 2025) | YoY Rent Change | Required Minimum-Wage Hours per Week per Renter 2024 | Required Minimum-Wage Hours per Week per Renter 2025 | Required Minimum-Wage Hours per Week per Renter 2026 |
| Atlanta-Sandy Springs-Roswell, GA | $1,543 | -2.30% | 87 | 85 | 85 |
| Austin-Round Rock-San Marcos, TX | $1,388 | -6.60% | 82 | 77 | 77 |
| Baltimore-Columbia-Towson, MD | $1,856 | 2.40% | 48 | 49 | 49 |
| Birmingham, AL | $1,180 | -4.60% | 68 | 65 | 65 |
| Boston-Cambridge-Newton, MA-NH | $2,870 | -2.50% | 78 | 77 | 77 |
| Buffalo-Cheektowaga, NY | $1,176 | 3.30% | 29 | 30 | 29 |
| Charlotte-Concord-Gastonia, NC-SC | $1,498 | -1.40% | 84 | 83 | 83 |
| Chicago-Naperville-Elgin, IL-IN | $1,804 | 0.00% | 48 | 48 | 48 |
| Cincinnati, OH-KY-IN | $1,319 | -3.10% | 51 | 49 | 48 |
| Cleveland, OH | $1,242 | 2.20% | 45 | 46 | 45 |
| Columbus, OH | $1,205 | 1.30% | 44 | 45 | 44 |
| Dallas-Fort Worth-Arlington, TX | $1,441 | -1.90% | 81 | 80 | 80 |
| Denver-Aurora-Centennial, CO | $1,742 | -4.80% | 49 | 47 | 46 |
| Detroit-Warren-Dearborn, MI | $1,327 | 0.20% | 50 | 50 | 39 |
| Hartford-West Hartford-East Hartford, CT | $1,836 | 3.60% | 43 | 45 | 43 |
| Houston-Pasadena-The Woodlands, TX | $1,369 | -2.70% | 78 | 76 | 76 |
| Indianapolis-Carmel-Greenwood, IN | $1,288 | 0.20% | 71 | 71 | 71 |
| Jacksonville, FL | $1,457 | -4.20% | 47 | 45 | 39 |
| Kansas City, MO-KS | $1,387 | 3.20% | 39 | 40 | 37 |
| Las Vegas-Henderson-North Las Vegas, NV | $1,434 | -3.00% | 49 | 48 | 48 |
| Los Angeles-Long Beach-Anaheim, CA | $2,776 | -2.00% | 69 | 67 | 66 |
| Louisville/Jefferson County, KY-IN | $1,244 | -2.40% | 70 | 69 | 69 |
| Memphis, TN-MS-AR | $1,165 | -1.60% | 65 | 64 | 64 |
| Miami-Fort Lauderdale-West Palm Beach, FL | $2,287 | -2.70% | 72 | 70 | 61 |
| Milwaukee-Waukesha, WI | $1,685 | 4.50% | 89 | 93 | 93 |
| Minneapolis-St. Paul-Bloomington, MN-WI | $1,503 | -0.90% | 55 | 54 | 53 |
| Nashville-Davidson–Murfreesboro–Franklin, TN | $1,511 | -2.10% | 85 | 83 | 83 |
| New Orleans-Metairie, LA | NA | NA | NA | NA | NA |
| New York-Newark-Jersey City, NY-NJ | $2,898 | 0.00% | 70 | 70 | 68 |
| Oklahoma City, OK | $994 | 0.50% | 55 | 55 | 55 |
| Orlando-Kissimmee-Sanford, FL | $1,650 | -1.80% | 52 | 51 | 44 |
| Philadelphia-Camden-Wilmington, PA-NJ-DE-MD | $1,739 | -1.50% | 97 | 96 | 96 |
| Phoenix-Mesa-Chandler, AZ | $1,445 | -4.00% | 41 | 39 | 38 |
| Pittsburgh, PA | $1,471 | 2.70% | 79 | 81 | 81 |
| Portland-Vancouver-Hillsboro, OR-WA | $1,641 | -2.60% | 42 | 41 | 41 |
| Providence-Warwick, RI-MA | NA | NA | NA | NA | NA |
| Raleigh-Cary, NC | $1,478 | -2.20% | 83 | 82 | 82 |
| Richmond, VA | $1,500 | 1.50% | 48 | 48 | 47 |
| Riverside-San Bernardino-Ontario, CA | $2,076 | -2.80% | 52 | 50 | 49 |
| Rochester, NY | $1,339 | 0.30% | 34 | 35 | 33 |
| Sacramento-Roseville-Folsom, CA | $1,839 | -2.10% | 46 | 45 | 44 |
| San Antonio-New Braunfels, TX | $1,207 | -2.70% | 68 | 67 | 67 |
| San Diego-Chula Vista-Carlsbad, CA | $2,688 | -3.50% | 67 | 65 | 64 |
| San Francisco-Oakland-Fremont, CA | $2,819 | 1.40% | 67 | 68 | 67 |
| San Jose-Sunnyvale-Santa Clara, CA | $3,363 | 2.50% | 79 | 82 | 80 |
| Seattle-Tacoma-Bellevue, WA | $1,942 | -0.70% | 47 | 47 | 45 |
| St. Louis, MO-IL | $1,305 | -1.30% | 38 | 38 | 35 |
| Tampa-St. Petersburg-Clearwater, FL | $1,672 | -2.50% | 53 | 51 | 45 |
| Virginia Beach-Chesapeake-Norfolk, VA-NC | $1,609 | 2.70% | 50 | 52 | 50 |
| Washington-Arlington-Alexandria, DC-VA-MD-WV | $2,264 | 0.50% | 51 | 52 | 52 |