Highlights
September 2025 rental trends
- September 2025 marks the 26th straight month of year-over-year rent decline for 0-2 bedroom properties since trend data began in 2020. Asking rents dipped by $36, or -2.1%, year over year.
- The median asking rent in the 50 largest metros registered at $1,703, $56 (-3.2%) lower than its August 2022 peak but $241 (16.5%) higher than the pre-pandemic level.
- Median rent declined in all size categories: studio: $1,426, down $14 (-1.0%) year over year; 1-bed: $1,582, down $38 (-2.3%) year over year; 2-bed: $1,885, down $42 (-2.2%) year over year.
Affordability
- In September 2025, nationwide rent was slightly more affordable than in the previous year. Renters earning the typical household income devoted 23.4% of their income to lease a typical for-rent home (vs. 24.9% in September 2024).
- 5 of the top 50 metros had a rent share higher than 30% relative to the median household income.
- Miami, FL, was the least affordable rental market in September 2025. The median rent for a typical 0-2 bedroom unit in Miami is 1.2 times as high as the estimated maximum affordable rent for the median household.
- Austin, TX claimed the top spot as the most affordable rental market in September 2025. The median rent for a typical 0-2 bedroom unit was just 55% of its estimated maximum affordable rent.
- Markets in the South and West—such as Jacksonville, FL, and San Diego, CA—continue to show the strongest improvements in affordability, while Kansas City stands out as the only market experiencing a decline.
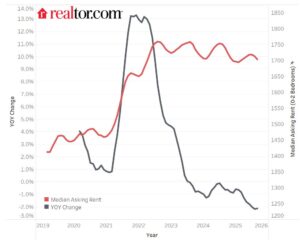
In September 2025, U.S. median rent recorded its 26th consecutive year-over-year decline. Rent for 0–2 bedroom properties across the 50 largest metropolitan areas dropped by 2.1% compared to the previous year, with the median asking rent at $1,703— $10 lower than the prior month.
This is the second month-over-month decline since March 2025, signaling the start of the rental market’s seasonal slowdown. Overall, 2025 has been a softer year for rents, with the median asking rent up just 0.4% year to date—well below the 1.9% increase recorded over the same period in 2024. Nevertheless, the U.S. median rent was just $56 (-3.2%) less than the peak seen three years ago in August 2022. Notably, it was still $241 (16.5%) higher than the same time in 2019 (pre-pandemic), but this increase is actually somewhat lower than what has occurred in overall consumer prices (up 26.3% in the 6 years ending August 2025) and pales in comparison to the 50.6% increase in median price-per-square-foot of for-sale home listings in the 6 years ending September 2025.
Figure 1: Rents Decline Again, but Nationwide Rent Is 3.2% Below 2022 Peak
All unit sizes saw rent declines
In September, the median asking rent for two bedroom units dropped -2.2% year-over-year, marking the 28th consecutive month of annual declines. The median rent for two bedrooms was $1,885 nationally, $72 (-3.7%) lower than the peak seen in August 2022. Meanwhile, larger unit rents had the highest growth rate over the past six years, up by $291 (18.3%).
The rent for one-bedroom units slipped -2.3% in September 2025 on a year-over-year basis, standing at $1,582 and was the 28th consecutive month of annual declines. It was $78 (-4.7%) lower than the peak observed during August 2022, but still $201 (14.6%) higher than in September 2019.
In September 2025, the median asking rent for studios fell by -1.0%, marking the 25th consecutive month of annual declines. The median rent of studios was $1,426 in September, down by $55 (-3.7%) from its peak seen in October 2022. Nevertheless, the median asking rent for studios was still $158 (12.5%) higher than six years ago.
Figure 2: All Unit Sizes Saw Rent Declines
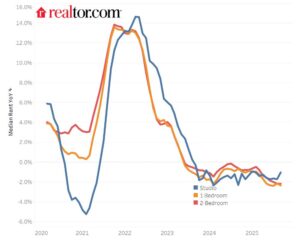
Table 1: National Rents by Unit Size, September 2025
| Unit Size | Median Rent | Rent YoY | Consecutive Months of Decline | Total Decline from Peak | Rent Change – 6 Years |
| Overall | $1,703 | -2.1% | 26 | -3.2% | 16.5% |
| Studio | $1,426 | -1.0% | 25 | -3.7% | 12.5% |
| 1-Bedroom | $1,582 | -2.3% | 28 | -4.7% | 14.6% |
| 2-Bedroom | $1,885 | -2.2% | 28 | -3.7% | 18.3% |
Rental affordability improved from a year ago
One approach to measuring rental affordability is the 30% rule of thumb. According to this rule, a household should spend no more than 30% of its gross income on housing costs. The U.S. Department of Housing and Urban Development uses this approach. HUD defines cost-burdened households as those paying more than 30% of gross income on housing (including utilities) and severely cost-burdened households as those paying more than 50% of income on rent (including utilities).
This report uses a rent share of income to measure rental affordability in September 2025. It compares the median monthly rents with the estimated median monthly household income. A higher value means that rental costs make up a more significant proportion of the typical household income every month, indicating a relatively less affordable rental market. Meanwhile, a lower share implies a much healthier housing environment and more after-housing discretionary income available for spending.
In 2025, the average median monthly household income among the top 50 metros was $7,263 and the monthly median listed rent for units with 0-2 bedrooms was $1,703 in September, suggesting rents made up 23.4% of a typical household income. In September 2024, the rent-to-income share was 24.9%, showing that, for the median household, the nation’s rental affordability has improved over the past year as rent prices have dipped and typical incomes have grown.
Coastal markets see the lowest affordability
As of September 2025, five of the top 50 U.S. metropolitan areas had rent burdens exceeding 30% of the median household income. Miami, FL ranked as the least affordable rental market, followed by Southern California and major coastal metros including Los Angeles, CA, New York, NY, Boston, MA, and San Diego, CA. Encouragingly, the rent-to-income ratio in all five of these metros has declined compared to the same time last year, signaling a modest improvement in affordability across these most cost-burdened markets.
Table 2: Rental Markets With a Rental Burden Above 30% of Income (0-2 Bedrooms)–September 2025
| Rank | Metros | Sep. 2025 Median Asking Rent | Sep.2025 Rent Share of Income | Percentage Point Changes (Sep. 2025
vs. 2024) |
Maximum Affordable Rent at Current HH Income | Sep. 2025 Rent vs. Max Affordable Rent (Ratio) |
| 1 | Miami-Fort Lauderdale-West Palm Beach, FL | $2,298 | 37.1% | -3.3 ppt | $1,857 | 1.24 |
| 2 | Los Angeles-Long Beach-Anaheim, CA | $2,821 | 37.0% | -1.4 ppt | $2,285 | 1.23 |
| 3 | New York-Newark-Jersey City, NY-NJ | $2,903 | 36.7% | -0.9 ppt | $2,374 | 1.22 |
| 4 | Boston-Cambridge-Newton, MA-NH | $2,944 | 32.3% | -0.7 ppt | $2,732 | 1.08 |
| 5 | San Diego-Chula Vista-Carlsbad, CA | $2,703 | 31.5% | -3.4 ppt | $2,577 | 1.05 |
Specifically, families looking to rent with a typical household income in Miami, FL, would spend 37.1% of their monthly paycheck on the typical rental in September 2025, a drop of 3.3 percentage points over 12 months ago. This improvement is needed, but rents are still pretty unaffordable in Miami. The median rent for a typical 0-2 bedroom unit in Miami is still 1.2 times as high as its estimated affordable rent, which limits rent to just 30% of the current typical household income.
Austin became the most affordable rental market
Austin, TX , overtook Oklahoma City, OK, to become the most affordable rental market. The median rent for a typical 0-2 bedroom unit just took up 55% of its estimated maximum affordable rent under the current median household income.
Specifically, families looking to rent with a typical household income in Austin would spend just 16.5% of their monthly paycheck on the typical rental in September 2025, a drop of 2.8 percentage points over 12 months ago. Other top affordable rental markets are Oklahoma City, OK, Raleigh, NC, Columbus, OH and Minneapolis, MN.
Table 3: Top 5 Most Affordable Rental Markets (0-2 Bedrooms)–September 2025
| Rank | Market | Sep. 2025 Median Asking Rent | Sep.2025 Rent Share of Income | Percentage Point Changes (Sep. 2025 vs. 2024) | Maximum Affordable Rent at Current HH Income | Sep. 2025 Rent vs. Max Affordable Rent (Ratio) |
| 1 | Austin-Round Rock-San Marcos, TX | $1,411 | 16.5% | -2.8 ppt | $2,560 | 0.55 |
| 2 | Oklahoma City, OK | $1,007 | 16.9% | -1.0 ppt | $1,788 | 0.56 |
| 3 | Raleigh-Cary, NC | $1,476 | 18.0% | -2.3 ppt | $2,453 | 0.60 |
| 4 | Columbus, OH | $1,217 | 18.1% | -0.6 ppt | $2,012 | 0.60 |
| 5 | Minneapolis-St. Paul-Bloomington, MN-WI | $1,511 | 18.7% | -1.1 ppt | $2,421 | 0.62 |
Affordability continued to improve in the West and South
Similar to our previous report, markets in the South and West saw significant improvements in rental affordability, led by Jacksonville, FL, San Diego, CA and Miami, FL. The primary driver behind this trend in both regions is the increase in new rental supply, which is helping to ease rent pressure and prices in these markets. According to a previous report by Realtor.com, the existing trend in multifamily completions suggests the rental housing stock will grow most in the South (1.5%) by fall 2025, followed by the West (1.2%), Midwest (0.9%), and Northeast (0.7%).
Table 4: Rental Markets With the Most Improved Affordability (0-2 Bedrooms)–September 2025
| Rank | Metros | Sep. 2025 Median Asking Rent | Sep. 2025 Rent Share of Income | Sep. 2024 Rent Share of Income | Percentage Point Changes (Sep. 2025 vs. 2024) |
| 1 | Jacksonville, FL | $1,466 | 21.5% | 25.0% | -3.5 ppt |
| 2 | San Diego-Chula Vista-Carlsbad, CA | $2,703 | 31.5% | 34.9% | -3.4 ppt |
| 3 | Miami-Fort Lauderdale-West Palm Beach, FL | $2,298 | 37.1% | 40.4% | -3.3 ppt |
| 4 | Denver-Aurora-Centennial, CO | $1,766 | 19.8% | 23.0% | -3.2 ppt |
| 5 | Austin-Round Rock-San Marcos, TX | $1,411 | 16.5% | 19.3% | -2.8 ppt |
| 6 | Phoenix-Mesa-Chandler, AZ | $1,448 | 19.8% | 22.5% | -2.7 ppt |
Across all the markets evaluated, Kansas City is the only market experiencing a higher rent share of income in September 2025, indicating worsening affordability. Specifically, families looking to rent with a typical household income in Kansas City would spend 20.9% of their monthly paycheck on the typical rental in September 2025, an increase of 0.6 percentage points over 12 months ago. Fortunately, this is still below the recommended share, but the trend indicates a growing cost burden for Kansas City renters.
Appendix: Rental Data–50 Largest Metropolitan Areas–September 2025
| Market | Median Asking Rent | YOY Change | Six Year Change | Sep.2025 Rent to Income Share | Sep.2024 Rent to Income Share |
| Atlanta-Sandy Springs-Roswell, GA | $1,556 | -3.5% | 8.3% | 21.2% | 23.1% |
| Austin-Round Rock-San Marcos, TX | $1,411 | -7.2% | 11.5% | 16.5% | 19.3% |
| Baltimore-Columbia-Towson, MD | $1,835 | 0.2% | 13.3% | 23.2% | 23.4% |
| Birmingham, AL | $1,180 | -5.6% | 11.2% | 19.8% | 22.4% |
| Boston-Cambridge-Newton, MA-NH | $2,944 | -0.9% | 13.3% | 32.3% | 33.0% |
| Buffalo-Cheektowaga, NY | NA | NA | NA | NA | NA |
| Charlotte-Concord-Gastonia, NC-SC | $1,484 | -3.5% | 14.2% | 21.8% | 23.8% |
| Chicago-Naperville-Elgin, IL-IN | $1,841 | 1.1% | 15.9% | 25.5% | 25.7% |
| Cincinnati, OH-KY-IN | $1,313 | -5.5% | 15.6% | 19.7% | 21.8% |
| Cleveland, OH | $1,235 | -0.3% | 26.0% | 21.6% | 21.9% |
| Columbus, OH | $1,217 | 0.0% | 21.0% | 18.1% | 18.7% |
| Dallas-Fort Worth-Arlington, TX | $1,431 | -2.9% | 13.9% | 19.3% | 21.3% |
| Denver-Aurora-Centennial, CO | $1,766 | -6.5% | 6.8% | 19.8% | 23.0% |
| Detroit-Warren-Dearborn, MI | $1,310 | -1.9% | 10.9% | 21.7% | 22.3% |
| Hartford-West Hartford-East Hartford, CT | NA | NA | NA | NA | NA |
| Houston-Pasadena-The Woodlands, TX | $1,337 | -3.0% | 7.6% | 20.3% | 21.9% |
| Indianapolis-Carmel-Greenwood, IN | $1,300 | -1.3% | 32.1% | 19.6% | 20.6% |
| Jacksonville, FL | $1,466 | -5.5% | 23.0% | 21.5% | 25.0% |
| Kansas City, MO-KS | $1,394 | 2.6% | 25.9% | 20.9% | 20.3% |
| Las Vegas-Henderson-North Las Vegas, NV | $1,428 | -4.4% | 17.8% | 23.6% | 26.0% |
| Los Angeles-Long Beach-Anaheim, CA | $2,821 | -1.4% | 12.6% | 37.0% | 38.4% |
| Louisville/Jefferson County, KY-IN | $1,247 | -3.2% | 22.3% | 20.6% | 22.2% |
| Memphis, TN-MS-AR | $1,174 | -4.3% | 13.2% | 21.0% | 23.4% |
| Miami-Fort Lauderdale-West Palm Beach, FL | $2,298 | -3.0% | 33.7% | 37.1% | 40.4% |
| Milwaukee-Waukesha, WI | $1,664 | -0.7% | 14.0% | 26.9% | 27.1% |
| Minneapolis-St. Paul-Bloomington, MN-WI | $1,511 | -2.8% | 3.4% | 18.7% | 19.8% |
| Nashville-Davidson–Murfreesboro–Franklin, TN | $1,500 | -5.1% | 20.0% | 21.1% | 23.5% |
| New Orleans-Metairie, LA | NA | NA | NA | NA | NA |
| New York-Newark-Jersey City, NY-NJ | $2,903 | 0.1% | 24.7% | 36.7% | 37.6% |
| Oklahoma City, OK | $1,007 | -1.6% | 7.8% | 16.9% | 17.9% |
| Orlando-Kissimmee-Sanford, FL | $1,660 | -3.2% | 21.2% | 26.6% | 28.8% |
| Philadelphia-Camden-Wilmington, PA-NJ-DE-MD | $1,759 | -2.7% | 6.7% | 23.9% | 25.3% |
| Phoenix-Mesa-Chandler, AZ | $1,448 | -6.4% | 17.1% | 19.8% | 22.5% |
| Pittsburgh, PA | $1,494 | 1.0% | 37.3% | 24.6% | 24.7% |
| Portland-Vancouver-Hillsboro, OR-WA | $1,678 | -3.4% | 13.2% | 21.3% | 22.7% |
| Providence-Warwick, RI-MA | NA | NA | NA | NA | NA |
| Raleigh-Cary, NC | $1,476 | -5.1% | 23.3% | 18.0% | 20.3% |
| Richmond, VA | $1,506 | -0.4% | 26.6% | 20.7% | 22.2% |
| Riverside-San Bernardino-Ontario, CA | $2,092 | -3.4% | 14.4% | 29.1% | 31.1% |
| Rochester, NY | NA | NA | NA | NA | NA |
| Sacramento-Roseville-Folsom, CA | $1,877 | -2.6% | 25.2% | 24.1% | 25.3% |
| San Antonio-New Braunfels, TX | $1,209 | -4.4% | 18.3% | 19.8% | 21.0% |
| San Diego-Chula Vista-Carlsbad, CA | $2,703 | -4.9% | 10.4% | 31.5% | 34.9% |
| San Francisco-Oakland-Fremont, CA | $2,836 | 1.0% | -2.2% | 25.5% | 26.3% |
| San Jose-Sunnyvale-Santa Clara, CA | $3,394 | 1.6% | 8.1% | 26.0% | 26.1% |
| Seattle-Tacoma-Bellevue, WA | $1,972 | -1.6% | 5.6% | 20.9% | 21.6% |
| St. Louis, MO-IL | $1,320 | -2.8% | 20.9% | 19.8% | 21.6% |
| Tampa-St. Petersburg-Clearwater, FL | $1,702 | -1.1% | 36.7% | 27.9% | 29.7% |
| Virginia Beach-Chesapeake-Norfolk, VA-NC | $1,520 | -1.6% | 22.3% | 22.7% | 23.3% |
| Washington-Arlington-Alexandria, DC-VA-MD-WV | $2,281 | -0.4% | 15.1% | 22.2% | 23.2% |
Methodology
Rental data as of September 2025 for studio, 1-bedroom, or 2-bedroom units advertised for rent on Realtor.com. Rental units include apartments as well as private rentals (condos, townhomes, single-family homes). We use rental sources that reliably report data each month within the 50 largest metropolitan areas. Realtor.com began publishing regular monthly rental trends reports in October 2020 with data history stretching to March 2019.
Rental affordability analysis: The affordable monthly rent is calculated by applying the 30% rule to the estimated 2025 monthly median household income nationwide ($7,263) across the 50 largest U.S. metros, on average) and in each metro. The monthly median household income is derived from the annual median household income data sourced from Claritas.