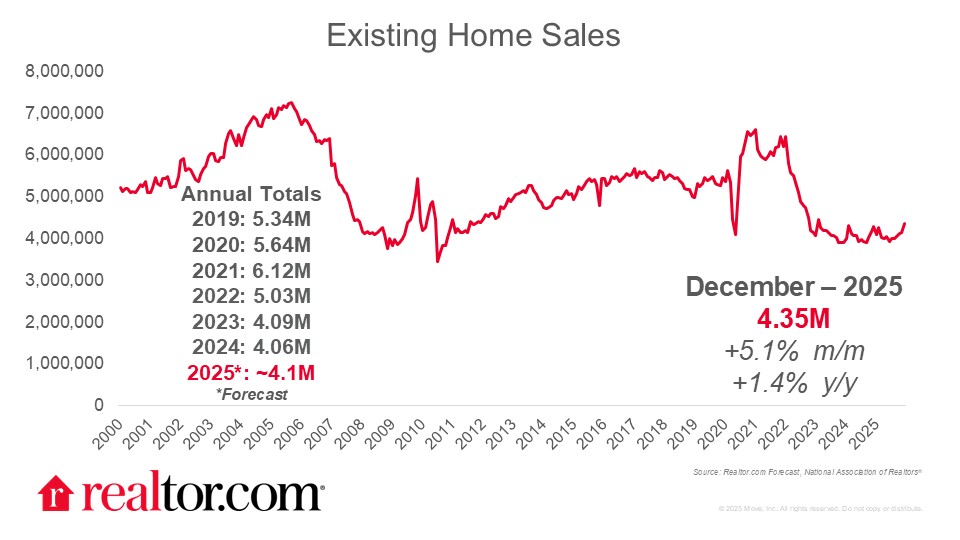
January 2026 existing-home sales
Existing-home sales dropped in January. Existing-home sales fell 8.4% to a 3.91M pace in January, and were down 4.4% from one year prior. Pending home sales fell in December from both the prior month and year despite lower mortgage rates, as new-inventory ebbed 1.8%, limiting the number of new choices buyers saw. Winter storm Fern, which dumped snow and ice across large swaths of the country, likely disrupted some closings, weighing on the data and making it difficult to pick out the housing market momentum trend from the weather noise.
Rough start, but there are reasons to be optimistic
Although the data show a lackluster start to the year for transactions, buyers and sellers have reasons for optimism. January homebuyers, who would likely have gone under contract in November and December, benefited from the lowest mortgage rates of 2025, yet mortgage rates are even lower now. NAR reported that total inventory rose 3.4% from a year ago to 1.18 million, improving options for buyers, and new listings edged up in January as well. Combined with the slower pace of sales, rising inventory helped edge months supply up to 3.7 months (from 3.5 months), back toward the 4 to 6 months supply range that is better-balanced between buyers and sellers.
Home prices rose modestly
Despite a seasonal drop in the month, home sales prices rose, with the median price climbing 0.9% from a year ago to $396,800. The typical U.S. asking price was essentially unchanged in January. Although a majority of the 50-largest markets saw softer asking prices, home prices grew in some areas, predominantly, but not exclusively in the Northeast and Midwest.
Weakness was widespread regionally, but degree varies
Regionally, January weakness was widespread, with sales falling in all 4 regions compared to the prior month and the prior year. This suggests weather was not the only factor weighing on sales. Declines were largest this month in the West (down 7.9% from a year ago and 10.3% in the month) and smallest in the Northeast (down 4.0% from a year ago and 5.9% in the month) with the Midwest (-7.1% Y/Y and -7.1% M/M) and South (-1.6% Y/Y and -9.0% M/M) falling in between. Reflecting weaker sales trends, home prices edged lower in the West, dropping 1.4% to $600,400. Prices in the other three regions rose, with the Northeast seeing the strongest growth (+5.8%) followed by the Midwest (+2.3%) and South (+0.1%).
In January, Realtor.com found that inventory recovery stalled and in many markets in the West and South where inventory exceeded the pre-pandemic benchmark, inventory moved back toward the benchmark. If sustained, this could suggest price firming and less regional divergence in the months ahead