
- AUD/NZD trades near the 1.0900 zone with minor losses on Friday.
- The pair maintains a bullish outlook despite mixed short-term signals.
- Key support is clustered below 1.0880, with resistance near 1.0920.
The AUD/NZD pair is experiencing mild selling pressure on Friday, hovering near the 1.0900 zone as the market approaches the Asian session. Despite the minor losses, the broader technical outlook remains constructive, with several key indicators aligning to support the pair’s upward trajectory. However, conflicting short-term signals suggest that further gains may face headwinds, as traders navigate a mix of buy and sell pressures.
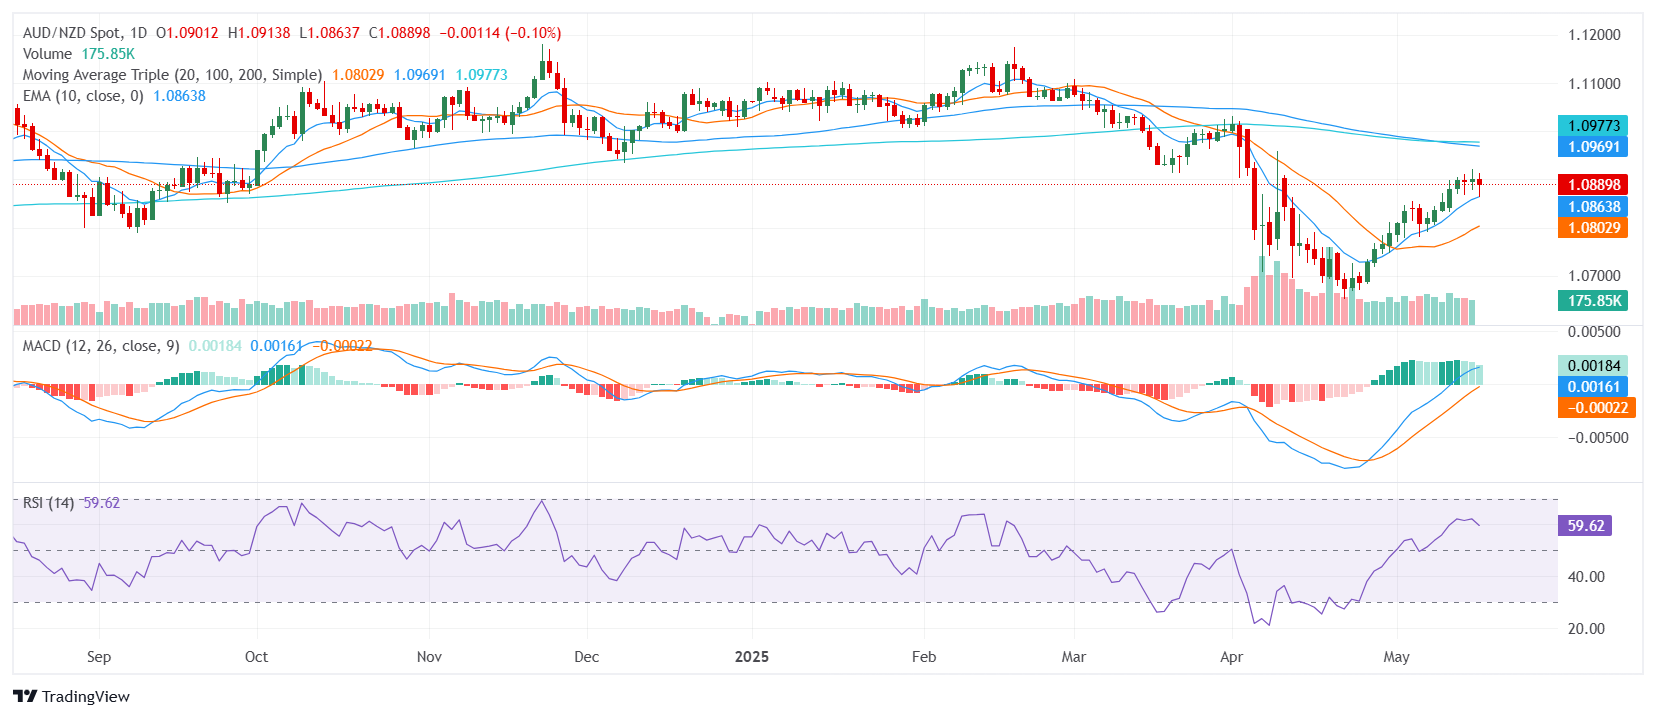
AUD/NZD maintains a generally bullish structure, supported by the alignment of short-term moving averages. The 20-day Simple Moving Average (SMA) indicates a buy signal, reflecting the pair’s recent strength, while both the 10-day Exponential Moving Average (EMA) and the 10-day SMA similarly point to upward momentum. However, the broader trend picture remains mixed, as the longer-term 100-day and 200-day SMAs still favor selling, highlighting the potential for deeper pullbacks if bullish momentum falters.
Momentum indicators provide a similarly divided outlook. The Relative Strength Index (RSI) hovers around the 50 level, indicating neutral conditions that align with the current price consolidation. Meanwhile, the Moving Average Convergence Divergence (MACD) signals buy momentum, reinforcing the broader bullish view. In contrast, the Stochastic %K, trading in the 80s, and the Stochastic RSI Fast, positioned in the 90s, both suggest overbought conditions, indicating the potential for near-term corrective moves. The Bull Bear Power, sitting near neutral, further highlights this lack of a decisive trend.
For now, immediate support is expected around 1.0871, with additional levels near 1.0867 and 1.0864. On the upside, resistance is likely to emerge around 1.0914, followed closely by 1.0923 and 1.0945, potentially capping any recovery attempts as the pair struggles to maintain its recent gains.
Daily Chart
Information on these pages contains forward-looking statements that involve risks and uncertainties. Markets and instruments profiled on this page are for informational purposes only and should not in any way come across as a recommendation to buy or sell in these assets. You should do your own thorough research before making any investment decisions. FXStreet does not in any way guarantee that this information is free from mistakes, errors, or material misstatements. It also does not guarantee that this information is of a timely nature. Investing in Open Markets involves a great deal of risk, including the loss of all or a portion of your investment, as well as emotional distress. All risks, losses and costs associated with investing, including total loss of principal, are your responsibility. The views and opinions expressed in this article are those of the authors and do not necessarily reflect the official policy or position of FXStreet nor its advertisers. The author will not be held responsible for information that is found at the end of links posted on this page.
If not otherwise explicitly mentioned in the body of the article, at the time of writing, the author has no position in any stock mentioned in this article and no business relationship with any company mentioned. The author has not received compensation for writing this article, other than from FXStreet.
FXStreet and the author do not provide personalized recommendations. The author makes no representations as to the accuracy, completeness, or suitability of this information. FXStreet and the author will not be liable for any errors, omissions or any losses, injuries or damages arising from this information and its display or use. Errors and omissions excepted.
The author and FXStreet are not registered investment advisors and nothing in this article is intended to be investment advice.


