
Luxury Market Showdown: Boston vs. Seattle
Highlights
- Similar field position at the median with listing prices for Seattle at $730,000 and Boston at $760,000 (U.S. median: $399,900).
- Luxury entry point splits at the goal line:
- Seattle (90th percentile): $1.70M (about 43% above the U.S. luxury entry point of $1.19M)
- Boston (90th percentile): $2.57M (about 51% higher than Seattle and more than double the U.S. benchmark)
- Both have depth in seven figures: Million-dollar listings make up 28.4% of Seattle’s inventory and 33.9% of Boston’s, well above the U.S. share (12.0%).
- Pace is solid, but Boston takes longer to move the chains at the top:
- Top 10% days on market: Boston 97 vs Seattle 85 (U.S.: 92)
- Top 10% days on market: Boston 97 vs Seattle 85 (U.S.: 92)
Two coastal economic hubs, two very different luxury playbooks
Boston and Seattle share some surface similarities. Both are coastal metros with highly educated workforces, large innovation economies, and global employer bases that support high-income housing demand. They also post a comparable scale of million-dollar inventory, averaging roughly 2,400 million-dollar listings per month over the last year (Seattle: 2,463; Boston: 2,373).
However, once you move from the broader market into the luxury red zone, the pricing profile diverges quickly.
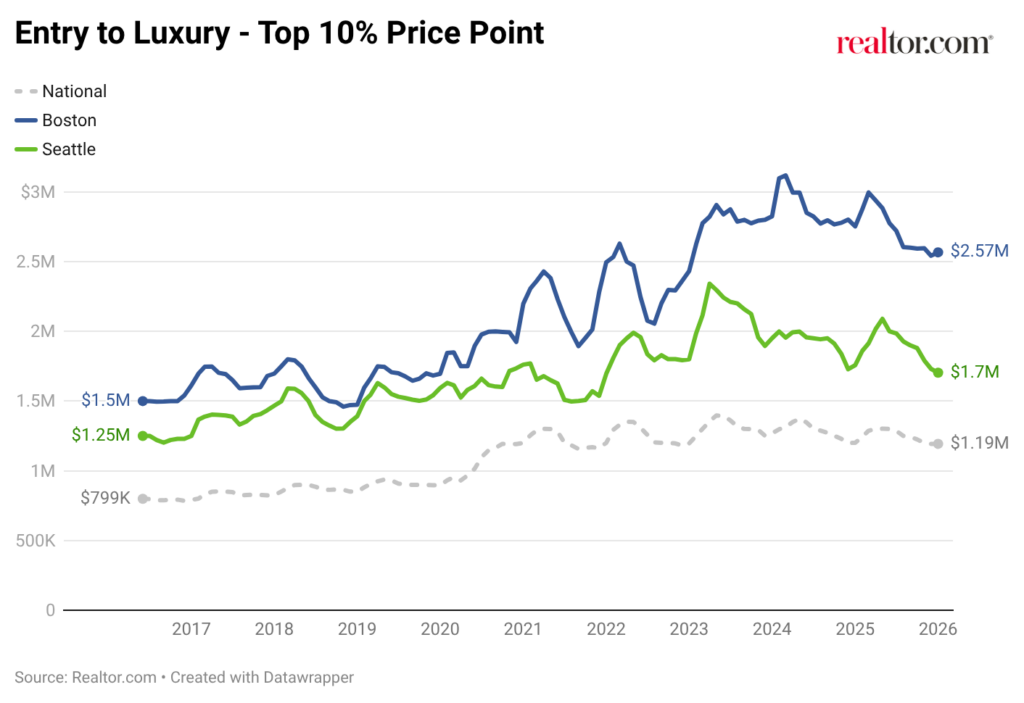
Seattle’s entry point to luxury begins at $1.70 million, a meaningful premium to the national benchmark ($1.19M) and a sign of strong top-tier demand. Boston’s luxury threshold, however, starts at $2.57 million, moving the goal post for the New England hub and placing it in a different pricing tier entirely.
Another way to consider the difference is structural separation. Boston’s luxury threshold sits at 3.4× its local median listing price, compared with 2.3× in Seattle (U.S.: 3.0×). In other words, Seattle’s luxury tier is elevated, but Boston’s is more clearly its own division.
Market behavior over time: the gap widened, even as both markets took a timeout
Boston and Seattle have both built larger luxury tiers since 2016, but they have not moved up the field the same way. Looking at the top 10%, Boston has steadily separated into a higher-priced top tier, while Seattle’s luxury threshold has remained elevated but more tethered to the national path in recent years.
- From June 2016 to January 2026:
- Seattle’s luxury entry rose from $1.25 million to $1.70 million (+36.3%, or +$453K).
- Boston’s luxury entry rose from $1.50 million to $2.57 million (+71.1%, or +$1.07M).
- The national luxury entry rose from $799K to $1.19 million (+49.3%, or +$394K).
Peaks and recalibration: both reset, but from different heights
Both markets reached a post-pandemic peak and then worked through a reset:
- Seattle peaked in April 2023 at $2.34 million, and by January 2026 it was down about 27.3% from that peak (to $1.70M).
- Boston peaked later, in March 2024, at $3.12 million, and by January 2026 it was down about 17.7% (to $2.57M).
- National peaked in May 2023 at $1.40M, and by January 2026 it was down about 14.5% (to $1.19M).
Even though both markets cooled from their highs, Boston’s luxury tier held onto more of its peak altitude than Seattle’s, and it did so at a much higher price level, some of which was longstanding and some of which is a result of faster pandemic-era price growth.
Luxury tiers (price thresholds)
| Area | 90th percentile | 95th percentile | 99th percentile |
| USA | $1,193,085 | $1,912,790 | $5,635,028 |
| Seattle | $1,703,180 | $2,563,833 | $6,500,000 |
| Boston | $2,566,359 | $3,924,499 | $9,834,000 |
Seattle’s 99th percentile begins at $6.5 million, above the national 99th percentile level of $5.6 million. Boston’s 99th percentile begins at $9.83 million, signaling an ultraluxury tier with a higher price ceiling.
Demand and pacing: Seattle is quicker at the luxury entry level
The market is moving in both metros, but the tempo differs once you focus on luxury entry. Boston luxury-entry homes spend a median of 97 days on market vs 85 days in Seattle. Seattle’s luxury entry point is clearing the market faster, supported by a lower starting price and a broader pool of buyers. Boston’s higher entry point comes with longer timelines, as the buyer pool above $2.5 million narrows and negotiations become more deliberate. The result is a different cadence, with Seattle moving more quickly while Boston advances at a slower, more methodical pace.
M.V.P. Scouting Report
Most Valuable Properties – Highest Priced ZIP Codes
Seattle’s Most Expensive ZIP Codes
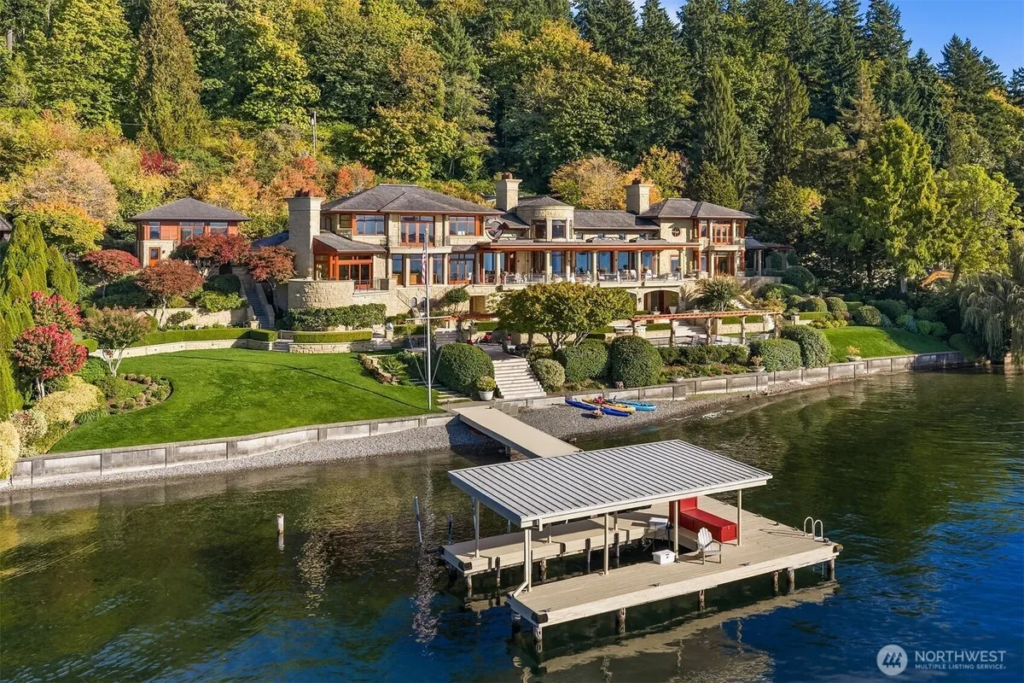
(Seattle Ultraluxury Home in Medina)
| Rank | ZIP | Area | Median listing price | Median square feet | Median Year Built |
| 1 | 98039 | Medina | $8,812,500 | 6,502 | 1983 |
| 2 | 98040 | Mercer Island | $3,395,000 | 3,695 | 1974 |
| 3 | 98024 | Fall City | $2,149,000 | 2,370 | 1990 |
| 4 | 98004 | West Bellevue | $1,799,450 | 1,550 | 1995 |
| 5 | 98006 | South Bellevue | $1,792,500 | 2,731 | 1982 |
Seattle’s most expensive ZIP codes cluster along Lake Washington and the Eastside, with Medina (98039) clearly setting the pace at the very top of the market. Known for waterfront estates, gated streets, and a concentration of tech executives and long-tenured wealth, Medina represents the region’s clearest ultraprime enclave. From there, pricing tapers into nearby communities like Mercer Island, Bellevue, and Sammamish, where newer housing stock, larger lots, and modern builds dominate the luxury landscape. Unlike Boston’s century-old brownstones and historic estates, many of Seattle’s top neighborhoods skew more contemporary, with median build dates largely in the late 20th century, reflecting a market shaped by recent growth rather than legacy inventory. The result is a more graduated, tiered structure, with one trophy enclave supported by several high-end but comparatively accessible luxury submarkets rather than a tight cluster of ZIP codes concentrated at the very top.
Boston’s Most Expensive ZIP Codes
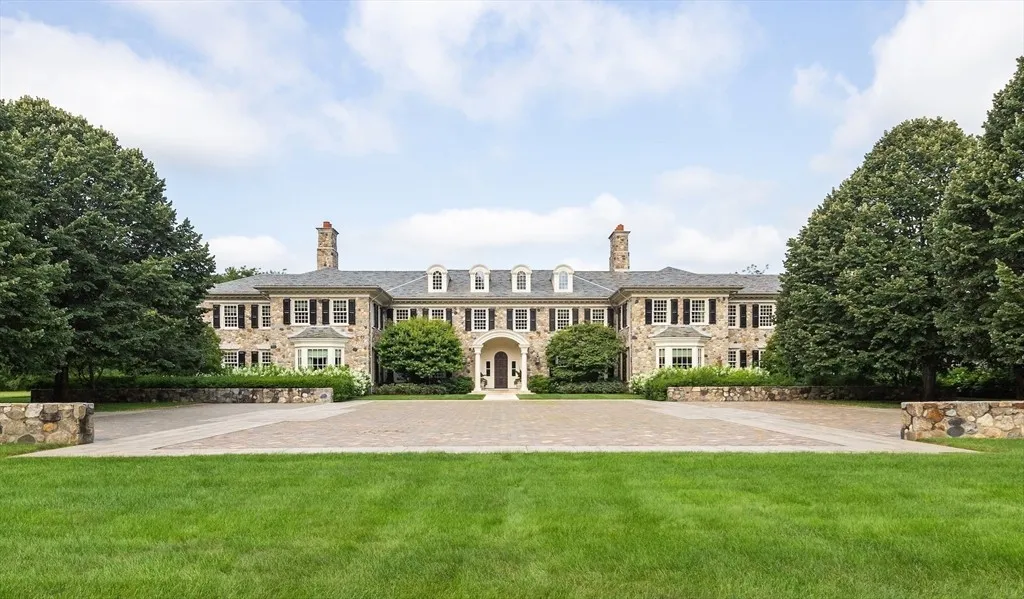
(Boston Ultraluxury Home in Weston)
| Rank | ZIP | Area | Median listing price | Median square feet | Median Year Built |
| 1 | 02199 | Back Bay | $6,299,000 | 2,435 | 2008 |
| 2 | 02493 | Weston | $6,200,000 | 8,451 | 1973 |
| 3 | 02108 | Beacon Hill | $5,995,000 | 3,640 | 1899 |
| 4 | 01944 | Manchester-by-the-Sea | $4,250,000 | 5,445 | 1959 |
| 5 | 01908 | Nahant | $3,995,000 | 7,792 | 1920 |
Boston’s most expensive ZIP codes concentrate across its historic urban core and nearby estate suburbs, with Back Bay (02199), Beacon Hill (02108), and Weston (02493) defining the upper boundary of pricing. Unlike Seattle’s newer luxury stock, several of Boston’s top neighborhoods trace their median build dates back more than a century, with homes commonly dating to the late 1800s and early 1900s. That older housing stock, combined with limited supply and architectural prestige, gives the market a distinctly rooted, heritage feel steeped in patriotism, where value is tied as much to history and permanence as to square footage or amenities. The result is a tighter, higher-priced core where ultraluxury homes cluster within a handful of long-established enclaves rather than spreading outward.
The takeaway:
Boston and Seattle both operate comfortably in seven-figure territory and sustain consistent demand at the upper end of the market, but the structure looks different. While each metro supports a large depth chart of million-dollar listings, the way luxury is distributed across the housing stock separates the two.
Seattle’s luxury market functions as a broad and active upper tier. The entry point is elevated relative to the national benchmark, homes move comparatively quickly, and high-end inventory is spread across multiple neighborhoods rather than concentrated in a small handful of enclaves. Luxury in Seattle is generally more integrated into the broader market, with depth, liquidity, and steady turnover supporting a wide base of buyers.
Boston’s luxury segment is more vertically segmented and price intensive. The entry threshold sits higher, a larger share of inventory clusters in the uppermost price bands, and timelines lengthen as values climb. Historic neighborhoods and tightly constrained supply anchor a more concentrated and higher-priced top tier, giving the market a distinct premium profile rooted in legacy, where established foundations continue to command a premium.
Seattle offers scale and accessibility within luxury, while Boston operates at higher entry thresholds with pricing concentrated in a tighter, more elevated top tier.
Methodology
All data in this report is sourced from Realtor.com® listing trends as of January 2026, reflecting active inventory of existing homes, including single-family residences, condos, townhomes, row homes, and co-ops. Listings reflect only those posted on MLS platforms that provide listing feeds to Realtor.com. New-construction listings are excluded unless actively listed on participating MLSs.
Metropolitan and micropolitan areas are defined using the Office of Management and Budget’s OMB-2023 delineations, with Claritas 2025 household estimates used for relative comparisons. Where appropriate, we limited analysis to metros or micros with a minimum threshold of active million-dollar listings on average over the past year to ensure meaningful comparisons.
Historical listing trend data extends to July 2016, but year-over-year comparisons in this report use January 2025 as the baseline.
Luxury by the Numbers
90th percentile = Entry-level luxury (top 10% of prices)
95th percentile = High-end luxury
99th percentile = Ultraluxury (often rare or custom properties)


